Google Analytics is an essential tool for digital marketers in order to analyse website data and gain a better understanding of a website’s performance. The tool provides site-wide or for single page insight in traffic, conversion rate, bounce rate, dwell-time, and so forth.
However, an overload of data can be overwhelming or confusing. If you’re unable to process the data, it becomes less valuable.
To help you get started with Google Analytics, I’ve listed a few basic actionable tips on getting the most out of Google analytics.
Let’s get to it!
1.Customise Dashboards
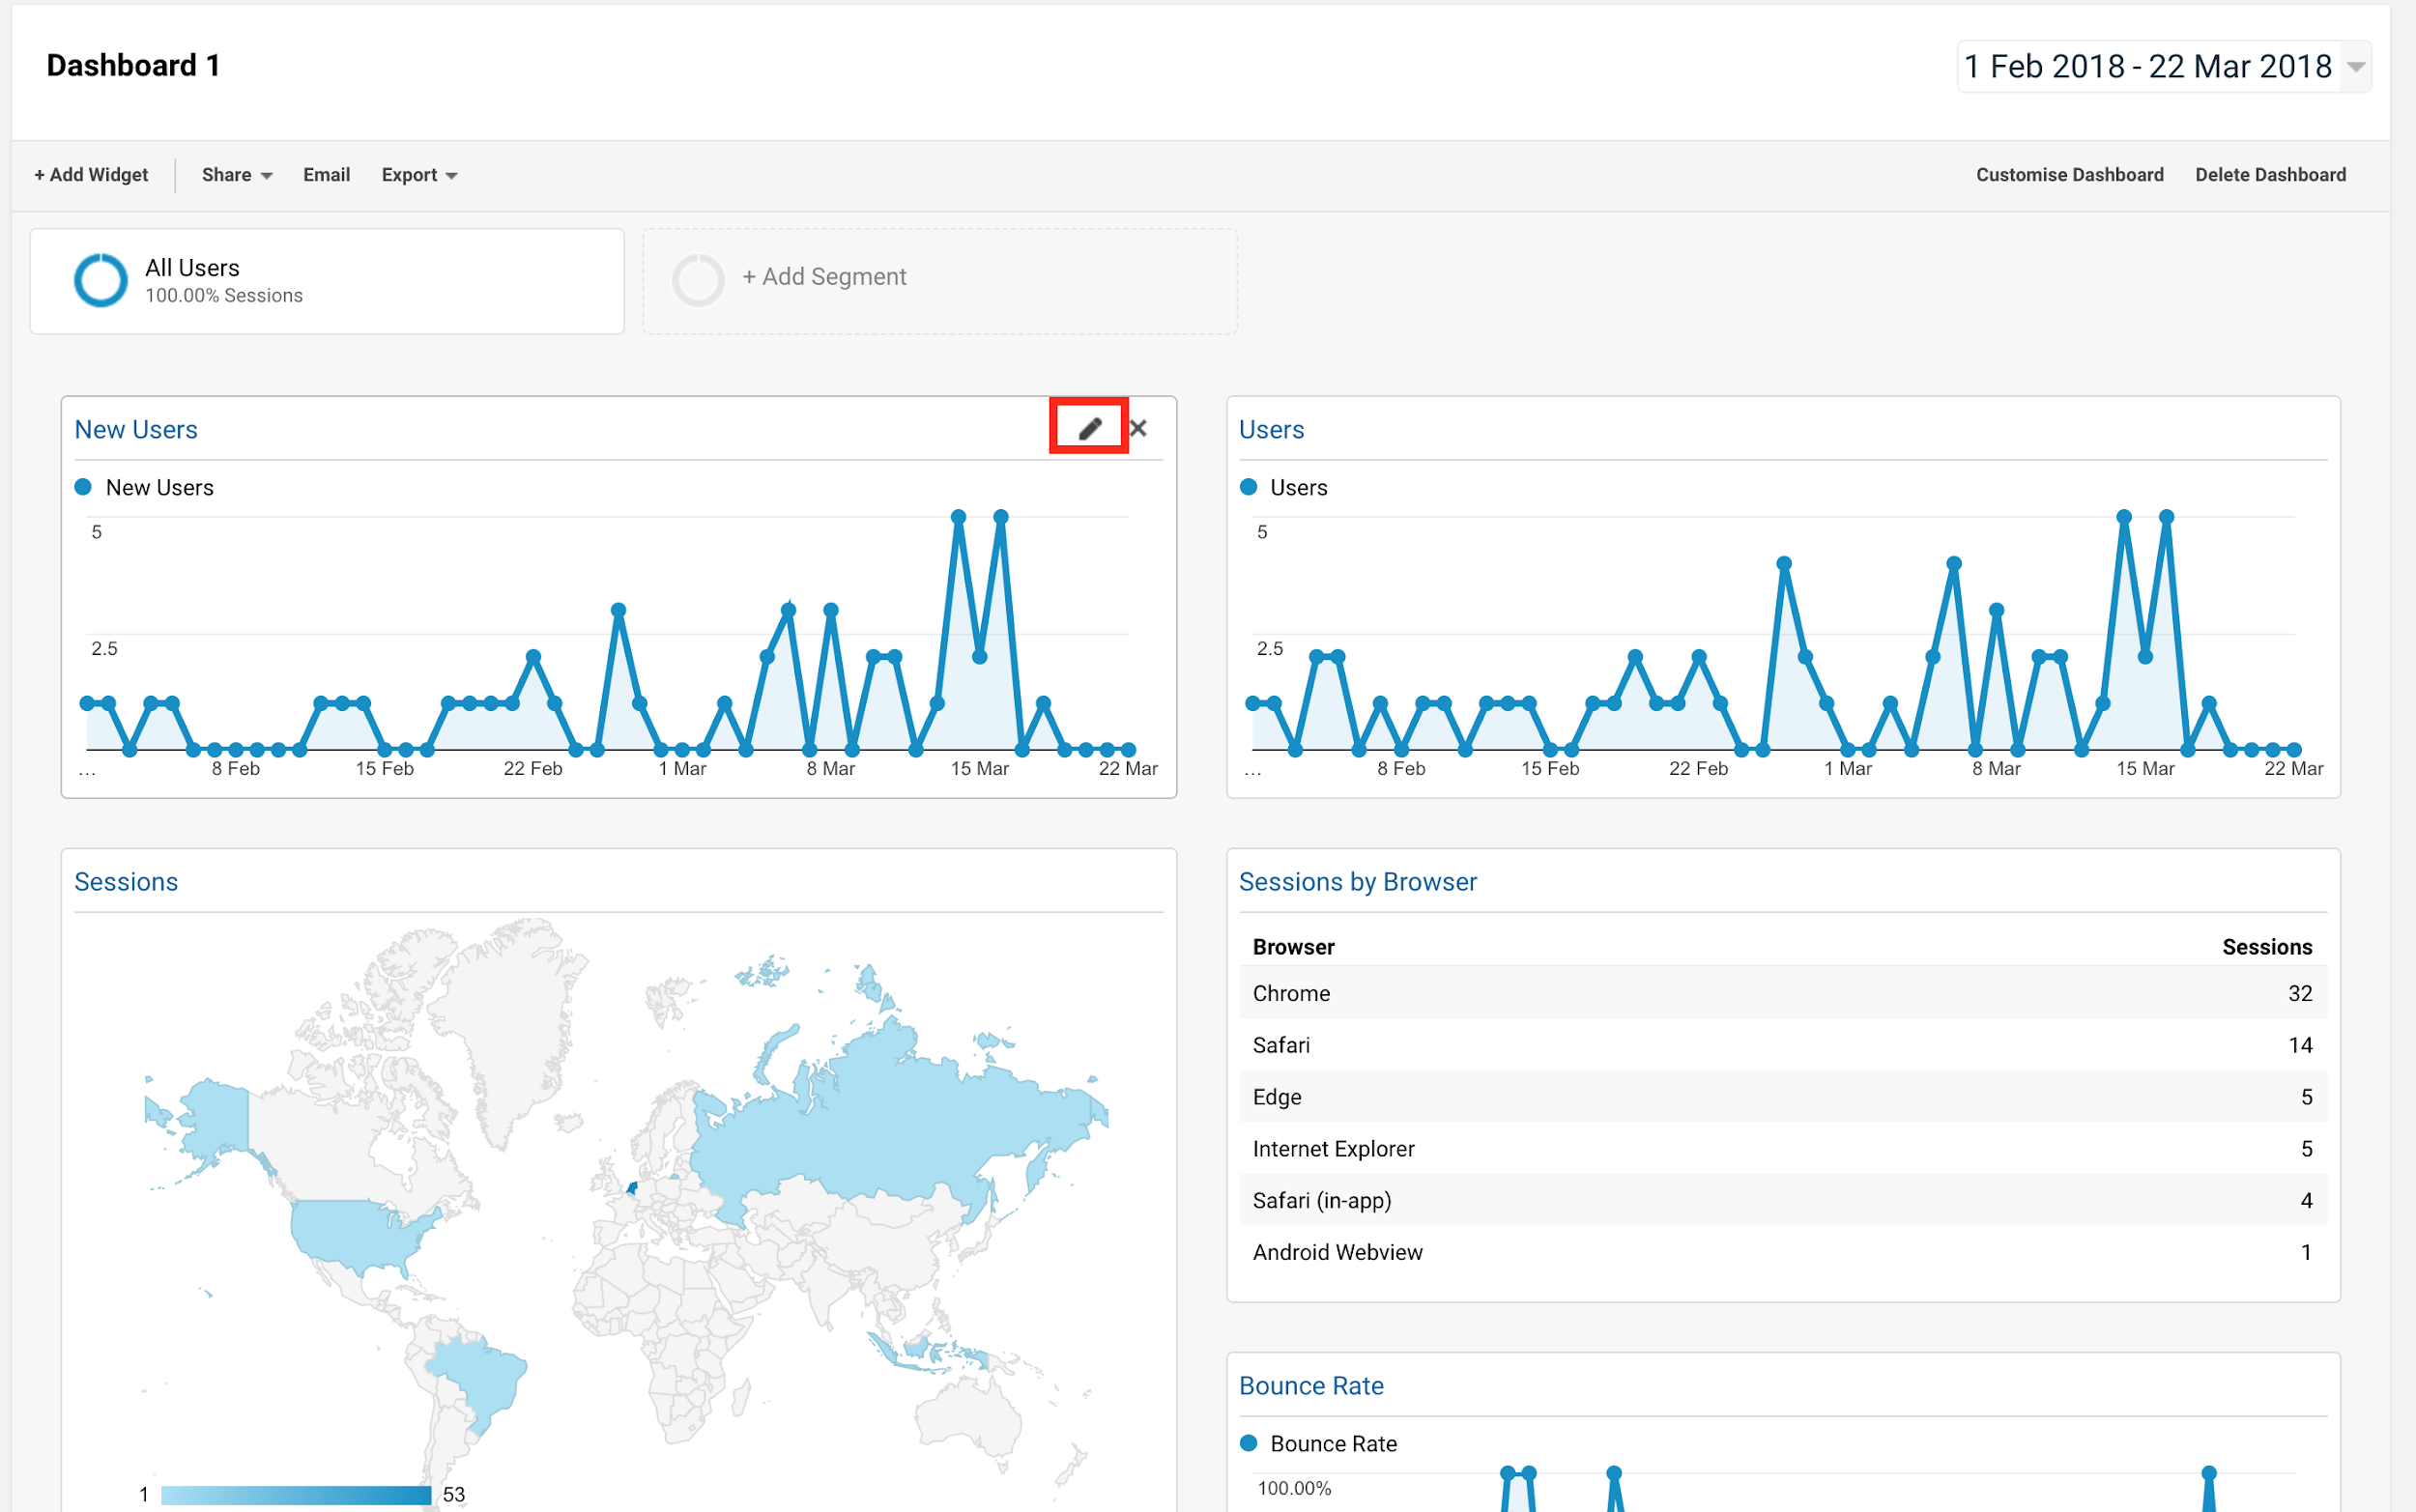
In order to customise dashboards, login to your Google Analytics account, check for the label “Customisation” in the left-hand sidebar and click on “Dashboards.”
You can use this feature to create up to 20 customised dashboards. Also, you can choose any metrics widget to appear in a dashboard, so all the important data will be shown in one particular overview.
Customised dashboards are in particular helpful to for reporting or to create a “helicopter-view” of certain key data points of a website in one overview.
2. Customise Date Range
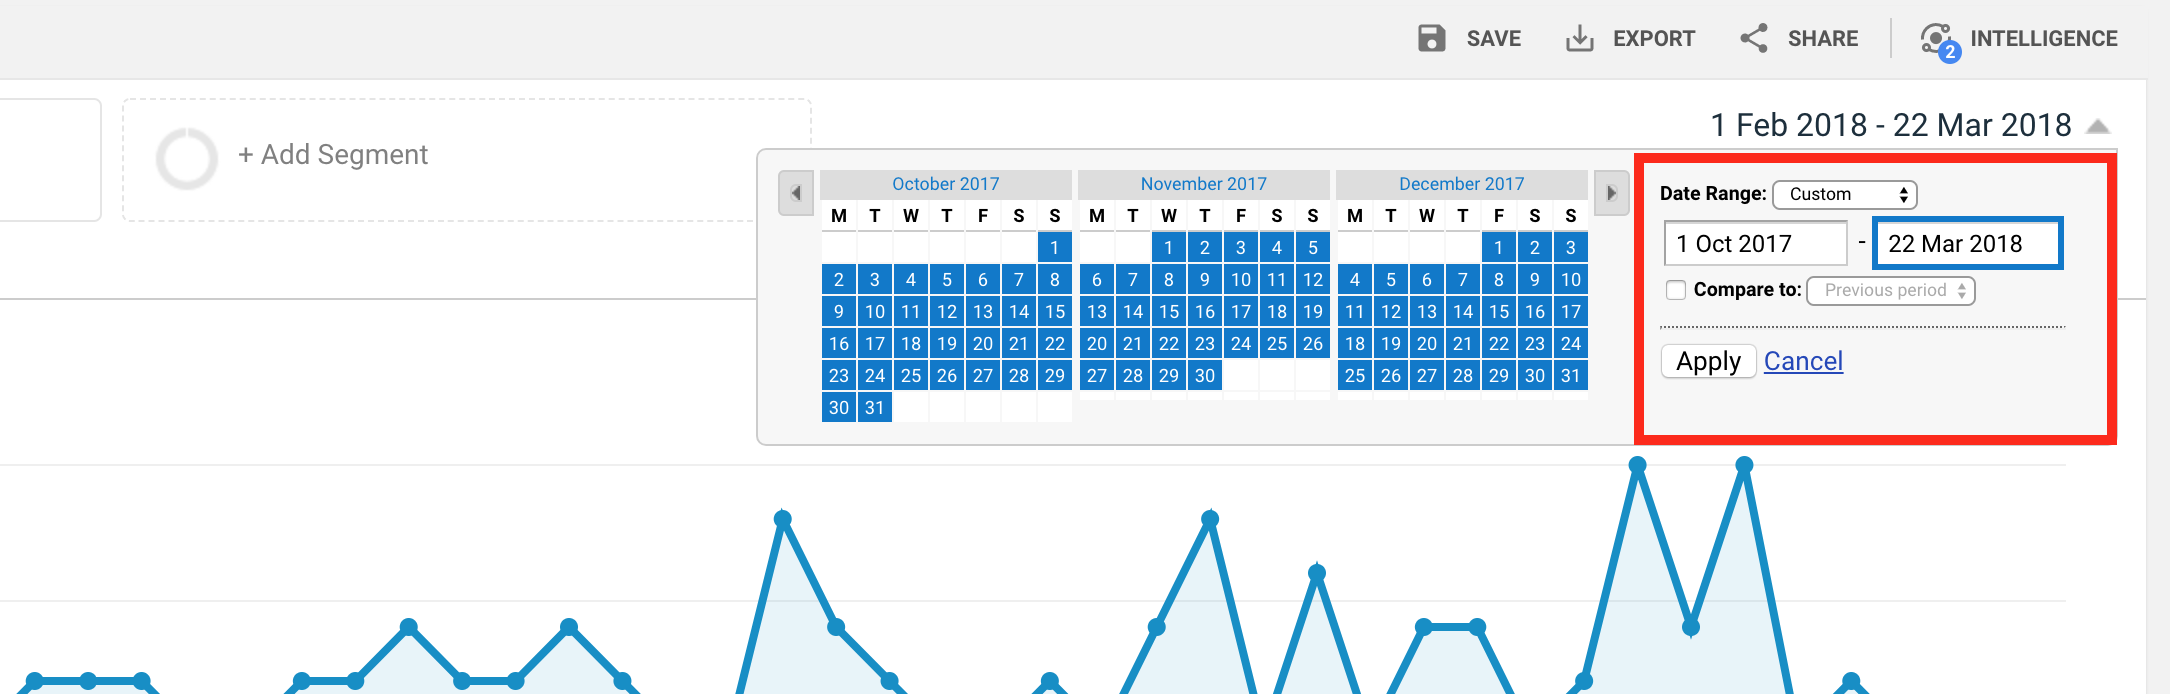
Generally, Google Analytics shows the results of the last 30 days. The drop-down menu allows you to select a maximum 30 days in the past, but you can simply adjust the data range for any type of data.
You can either fill out the date range manually (in this example, the red-highlighted box), or you can use the calendar to select a specific date.
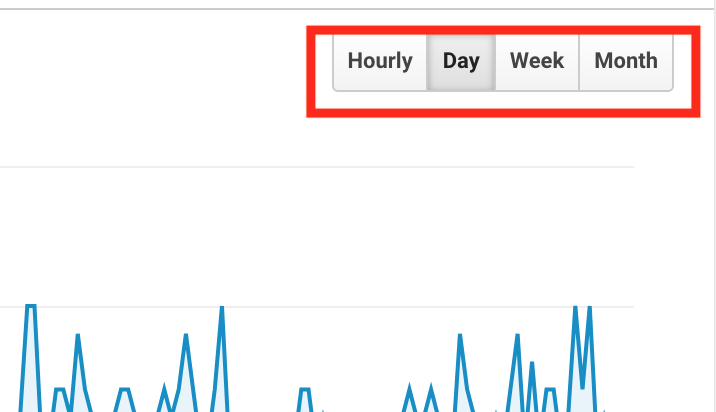
In addition, you can customise the graph based on 4 insight options: Hourly, Day, Week, Month.
This is particularly useful if you ran a campaign for a week and compare the data to a week without and promotional activities.
3. Setup Goals
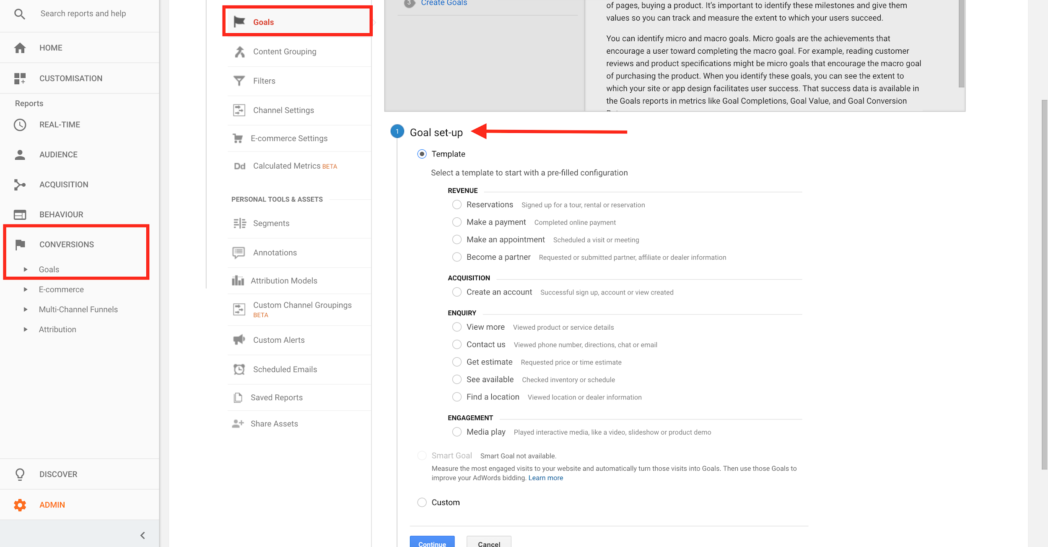
If you want to set up goals in Google Analytics, locate “Conversions” in the sidebar. Then select the first option “Goals” and click on “Set up Goals”. Once you’re in the goal creation dashboard, click on “+ New Goal”.
Creating goals is very helpful for marketers to measure conversion rates, email sign-ups, or any other type of action performed by your website’s visitors.
4. Browser & Operating System Metrics
In order to check browser and operating system data of your site’s visitors, find “Audience” in the left sidebar and go down the list and unfold the “Technology” tab. Then, click on “Browser & OS.”
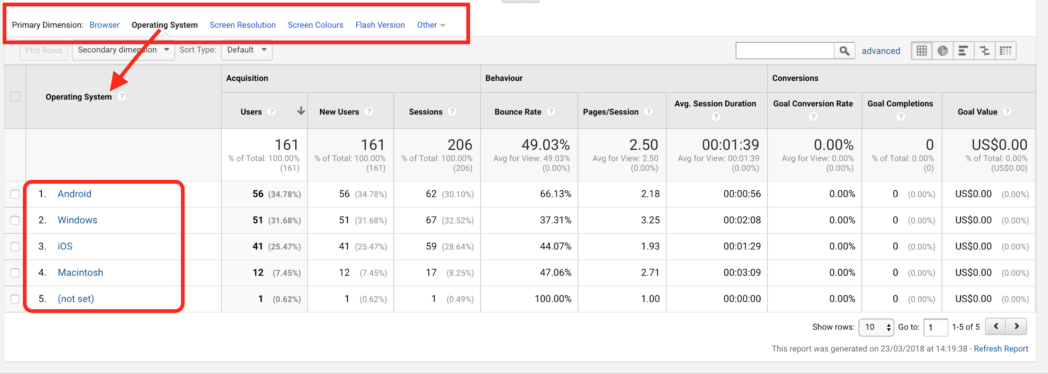
The horizontal menu allows you to choose between “Browser, Operating System, Screen Resolution, and more.”
This overview can be very helpful if, for example, you want to make a decision whether to implement Accelerated Mobile Pages (AMP) in order to create a better UX for mobile visitors.
5. Location of Your Audience

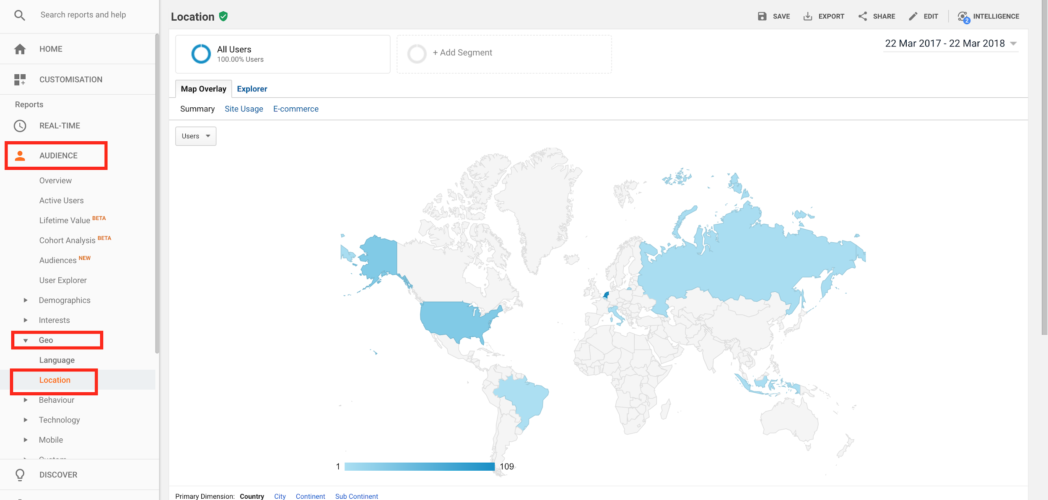
To learn more about the location of your visitors, go to “Audience” and go down the list and unfold the “Geo” tab. Next, click on “Location.”
You’ll see an overview of the world map and your website’s visitors. Below this map, you can get better insights into the actual data numbers.
It’s a helpful feature for marketers operating on an international level, because the target audience for a marketing campaign can be optimized by knowing where most of your audience is located. It’s even possible to determine this based on city, country, and continent data.
6. The Content Drilldown
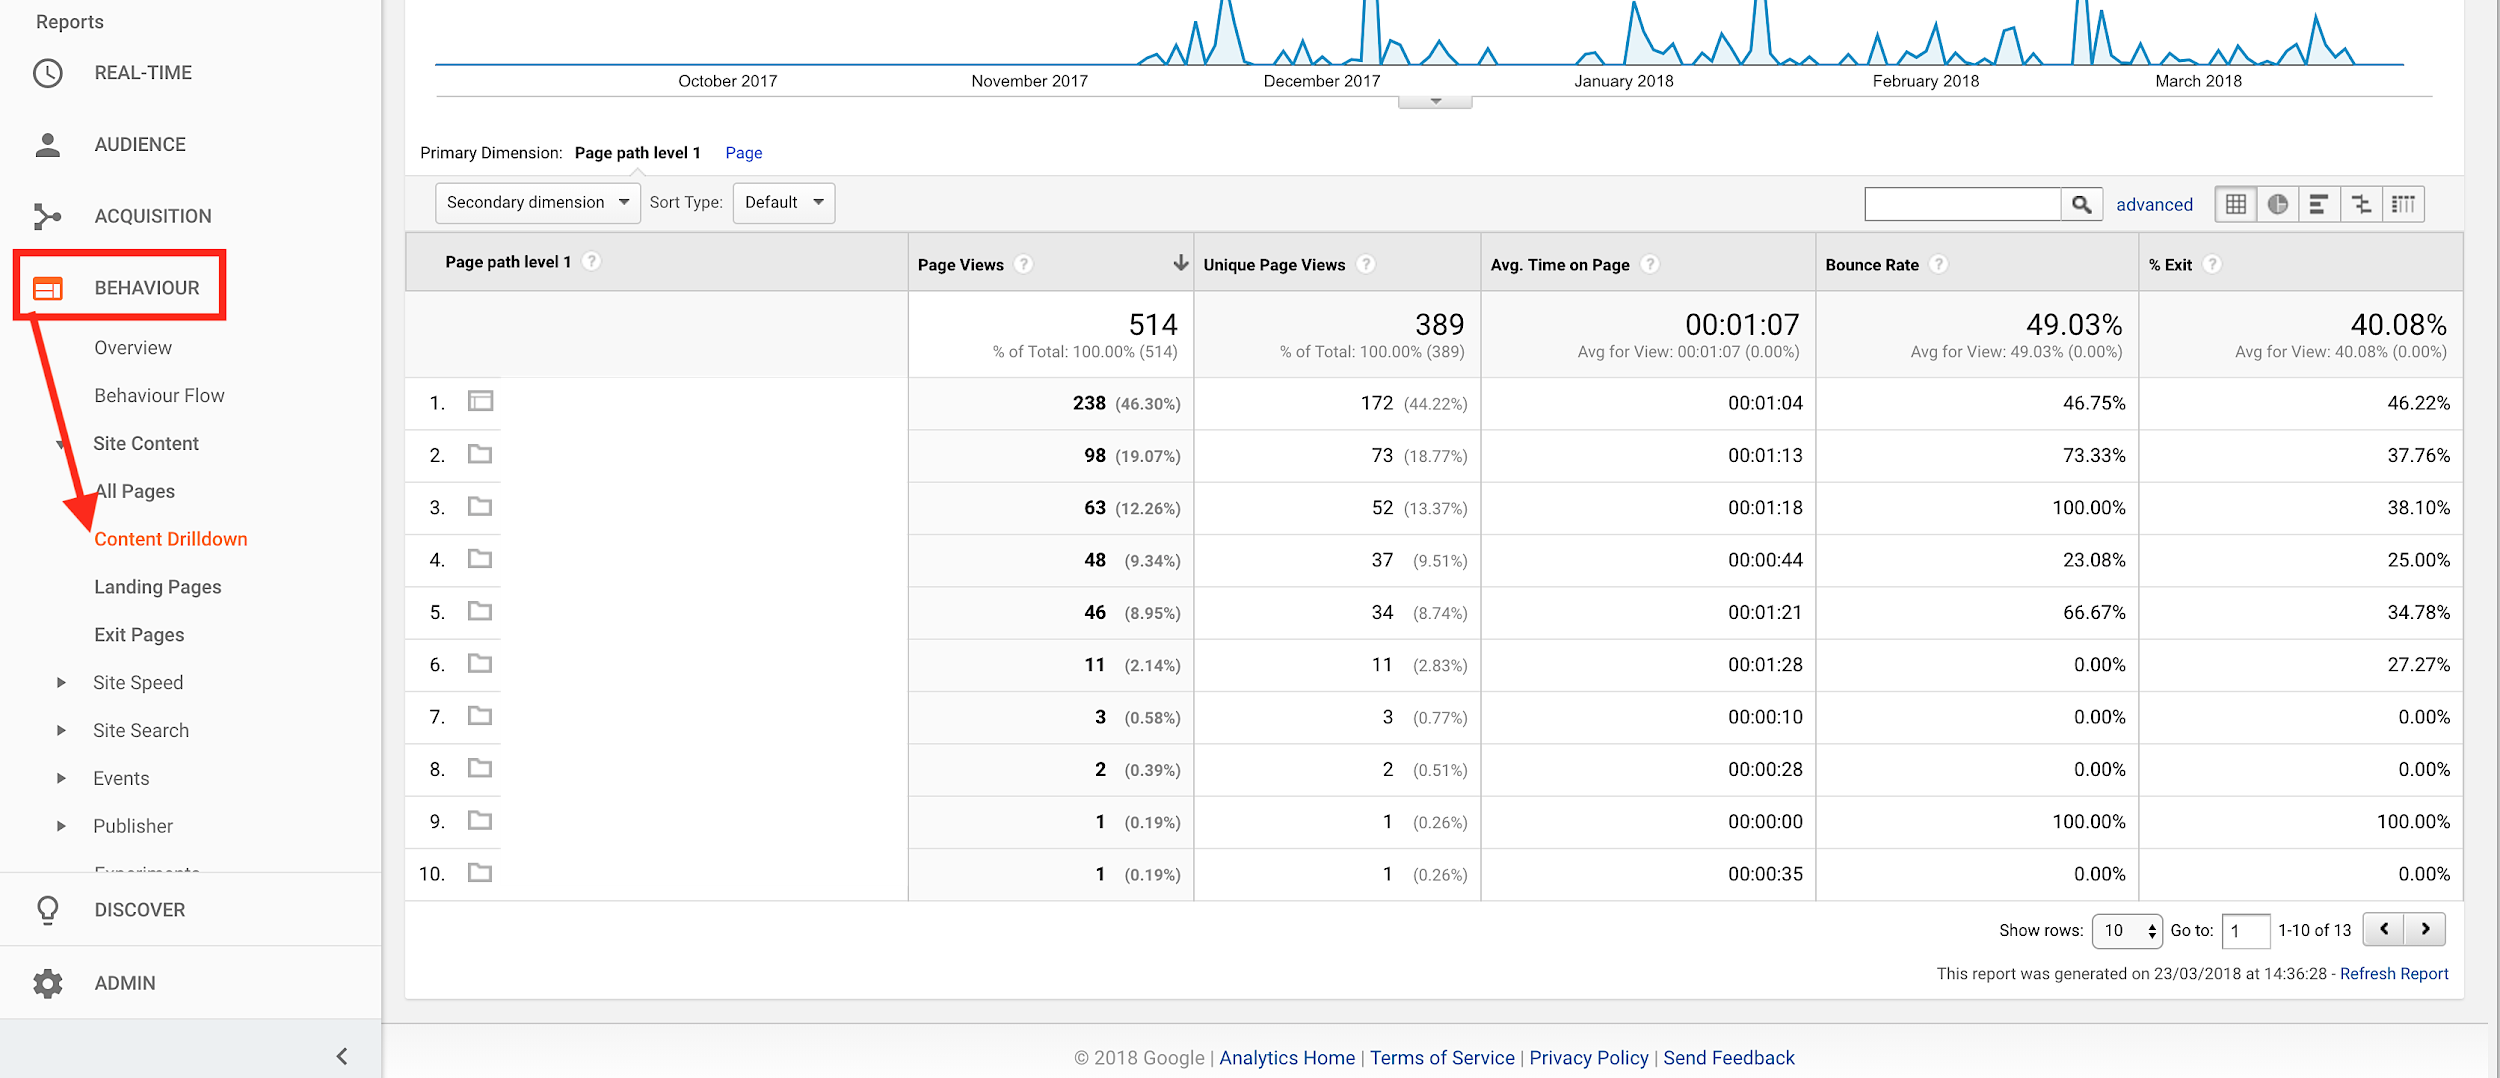
To find The Content Drilldown, unfold the “Behaviour” tab in the left sidebar and then locate “Site Content”. After you unfolded “Site Content”, click on “Content DrillDown.”
It’s an awesome feature to get a great understanding of the performance of particular pages on your website. It’s not only based on visitors, but a number of other data points such as unique page views, average time on page, bounce rate and dwell-time (time spent page).
7. Group Your Audience by Using Segments
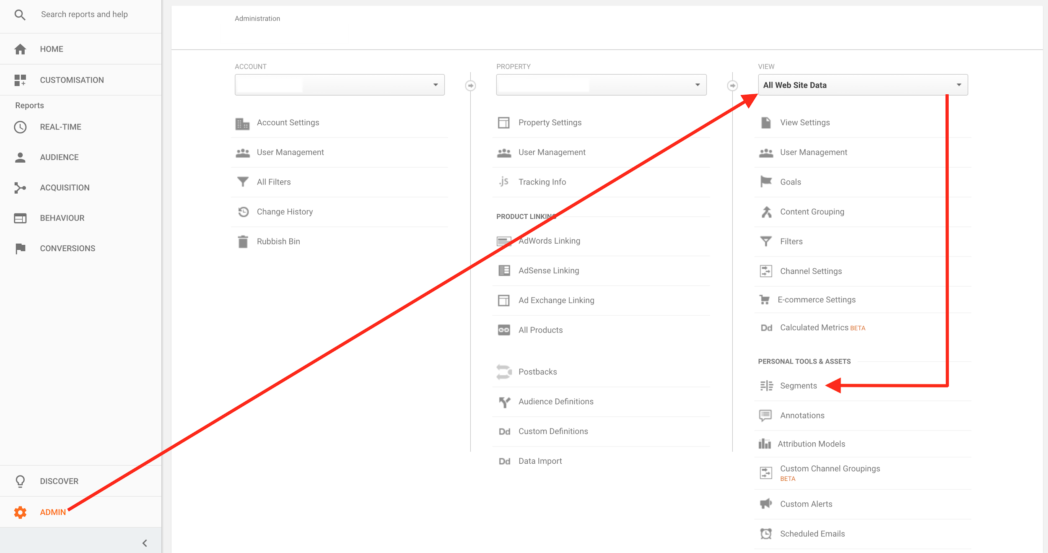
In order to create audience segments, click on “Admin” at the bottom of the menu bar, then hover to the most-right located column and go down the list to “Segments” under the section “Personal Tools & Assets.” Next, click on “+ New Segment.”
You’ll see the following overview: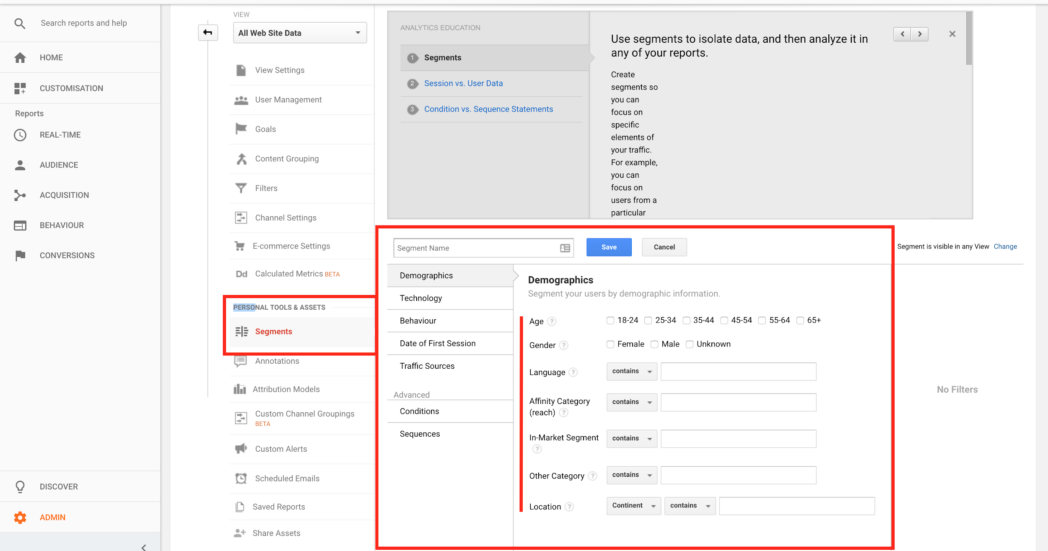
This tool is very helpful when it comes to get very specific information about your audience and create segments between age groups, language, gender, country, and so forth. This will assist you when you want to understand what’s working for specific segments of your audience and where you can improve.
8. How Are Visitors Using Your Site?
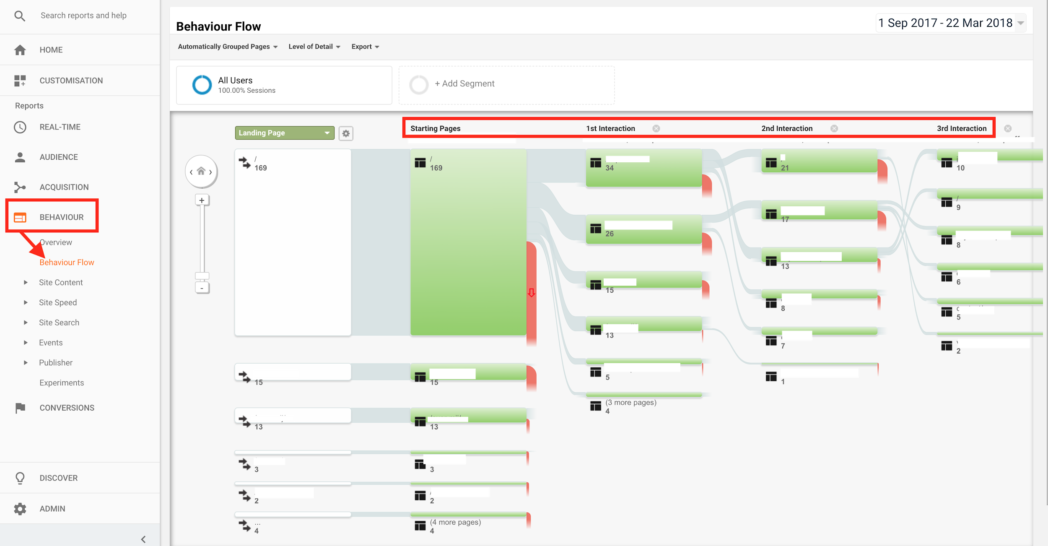
Note: it’s very obvious here, but I blurred out the URLs for privacy reasons in this example.
In order to get to this overview, go to “Behavior” and then select “Behavior Flow.”
At first sight, this particular overview might be a little confusing, but the Behavior Flow shows exactly on what pages people land on during their first visit, and also what other pages your visitors click on.
It’s basically showing how people explore your website, how they get to particular pages and how many continue to click further. It’s useful for marketers in order to optimize sales funnels and to spot what pages require improvement.
PixelPrivacy.com![]()
![]() is all about making the world of online security accessible to everyone. We pride ourselves in writing guides that we’re certain even our own mothers could understand! Be sure to head over to our blog if you’re interested in keeping your private information just that: Private!
is all about making the world of online security accessible to everyone. We pride ourselves in writing guides that we’re certain even our own mothers could understand! Be sure to head over to our blog if you’re interested in keeping your private information just that: Private!
Cool blog! Is your theme custom made or did you download it from somewhere? A design like yours with a few simple tweeks would really make my blog jump out. Please let me know where you got your theme. Kudos
good one keep it up
Thanks for the information